PTE Describe Image With Answers – PTE Describe image is one of the challenging tasks in PTE speaking. You are required to describe the important information in a graph, a series of graphs, a table, a map or a process. Please look at the image for 25 seconds and describe it in 40 seconds. Write your own answers in the comment section. The sample answers will be provided after each question.
PTE Describe Image With Answers

PTE Describe Image With Answers
Describe Image PTE Practice Test Question 1
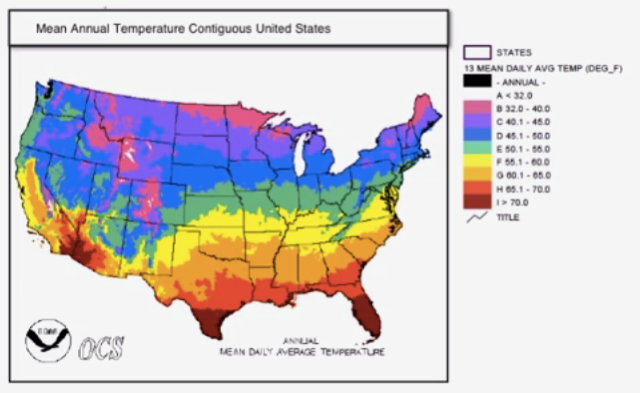
This image represents the mean annual temperature across the United States. The southern states are hotter with the mean daily temperature ranging from 70-degree Fahrenheit and above while northern states are the coldest with temperature ranging from 32 to 40 degrees Fahrenheit. The states located in the middle of the country show the temperature range from 50 to 60-degree Fahrenheit. In conclusion, the daily temperature is very high and far southern region and very low in the far northern region.
PTE Describe Image Practice Test Question 2
PTE Describe Image Practice
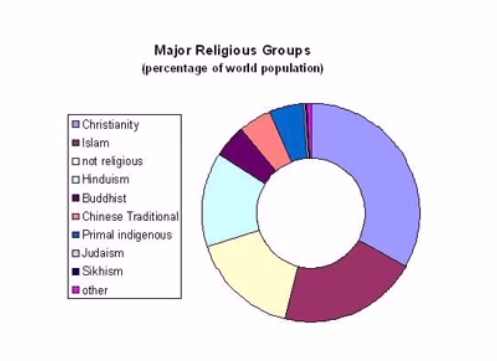
The chart represents the proposition of major religious groups in the world. Christianity is the biggest religious groups with about 30 percent people in the world area proposition which is closely followed by Islam with about 25 percent of the world’s population. About 20 percent people in the world are not religious while 15 percent of people follow Hinduism. A small number of population in the world is Buddhist. Traditional Chinese and smallest portion follow Primal indigenous, Judaism and Sikhism.
PTE Describe Image Practice Test Question 3
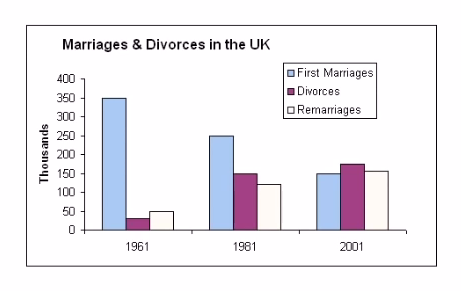
PTE Describe Image Practice Sample With Answers
This bar chart represents the number of marriages, divorces and remarriages occurred in the UK during the year 1961, 1981 and 2001. In the year 1961, there were 350 thousand first marriages, miner percent got divorced and about 50 thousand got remarried. In the year 1981 the first marriages reduced to 250 thousand and more then half of the couples got divorced and almost equal number got remarried. However, in the year 2001 higher number couple got divorced. In conclusion, the first marriages reduce in number while divorced rate and remarriage increase dramatically over the 40 years period.


