PTE Describe Image Practice – PTE Describe image is one of the challenging tasks in PTE speaking. You are required to describe the important information in a graph, a series of graphs, a table, a map or a process. Please look at the image for 25 seconds and describe it in 40 seconds. Write your own answers in the comment section. The sample answers will be provided after each question.
PTE Describe Image Practice Sample Questions

Describe Image PTE Practice
PTE Describe Image Practice Test Question 1
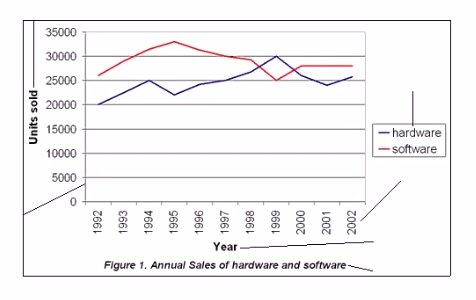
This line graph represents the annual number of hardware and software sold the form year 1992 to 2002. In the year 1992, 20 thousand units of hardware and over 25 thousand units of software were sold. There was a dramatic increase in the sale of software for next three years before following back to original sales number in the year 1999. There was a gradual increase in hardware sales until 1999 before following back to 25 thousand units. In conclusion, software sales were higher during the 10 year period during the hardware sales were less promising except in the year 1999.
Describe Image PTE Practice Test Question 2

PTE Describe Image Questions With Answers
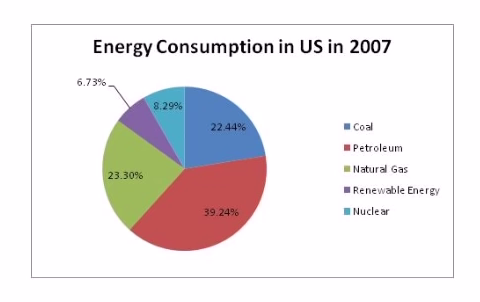
This pie chart represents energy consumption in the US during the year 2007. Petroleum was the most efficient energy source at about 40 percent while coal and natural gas were second highest in consumption with just under quarter in the proposition. About 9 percent energy was obtained from the nuclear source while about 7 percent was from renewable sources. In conclusion, United States was largely dependent on traditional sources of energy and very small amount energy came from renewable sources during the year 2007.
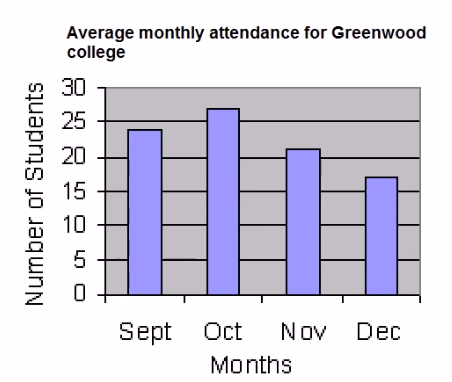
PTE Describe Image Practice Test Question 3
PTE Describe Image Question Bank
This bar graph represents the average monthly attendance for Greenwood collage from September to December. The number of students attended the college during the month of September was about 24. The number grew to over 26 students in the month of October. During last two months, the attendance falls dramatically just about 18 students in the month of December. In conclusion, the attendance drop at the end of the year probably because of Christmas and New Year holidays.