PTE Describe image is one of the challenging tasks in PTE speaking. You are required to describe the important information in a graph, a series of graphs, a table, a map or a process. Please look at the image for 25 seconds and describe it in 40 seconds. The sample answers will be provided after each question.
PTE Describe Image Practice Sample
PTE Describe Image Practice 1
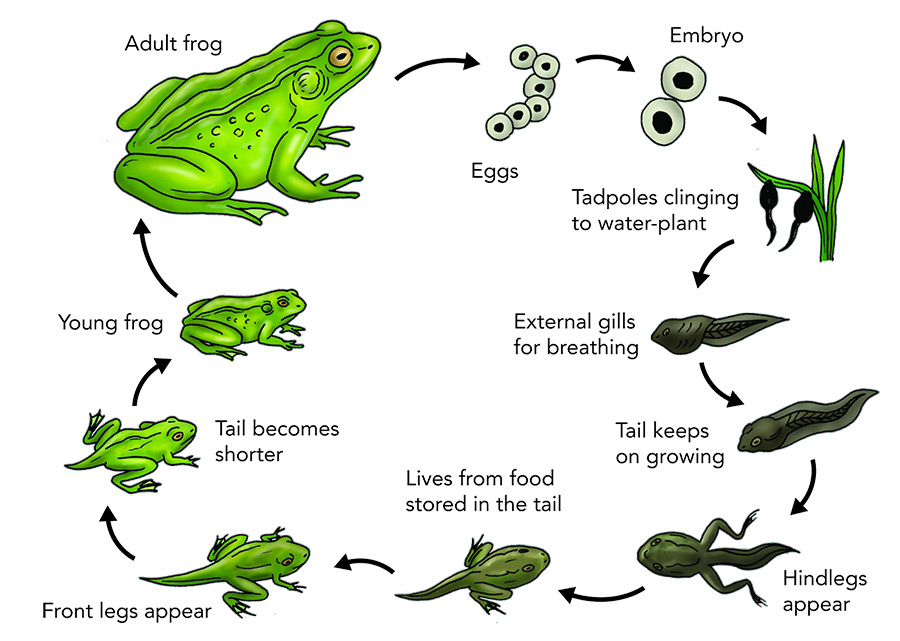
Life Cycle of a Frog PTE Practice
The image represents the life cycle of a frog. An adultery eggs which then get hatched and embryo emerge out of it and turn into tadpoles clinging to the water plant. A tadpole uses its external skin to breath and its tail keeps growing. Hindlegs starts to appear within few days. A tadpole uses food stored in its tail for survival. Few days later the front legs start to appear and tail become shorter. Thus tadpoles turn into a young frog. After few days it becomes an adult frog which will lend more eggs.
PTE Describe Image Practice 2
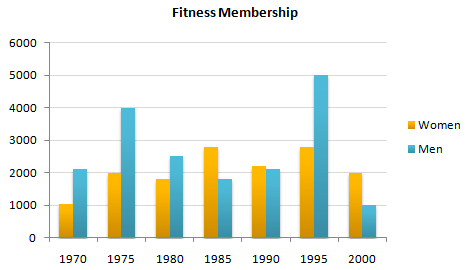
PTE Describe Image Fitness Membership
The images represent fitness membership data for men and women from the year 1970 to 2000. Until years 1980 more number of men were the members of the fitness club. Well if we compare the year 1985 and 1990, more female choose to become a member. Throughout the year 1995, the membership ratio for men was dramatically higher than women. Nevertheless, in the year 2000 least number of men participated in the fitness club membership. In conclusion, men were more health conscious compared to women for the period provided.
PTE Describe Image Practice 3
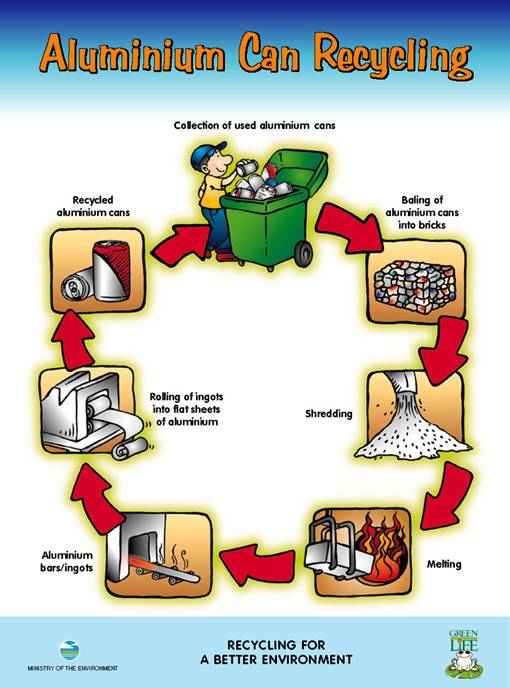
Describe Image Practice Test
This image represents the recycling process of aluminium cans. In the first stage, the used aluminium cans are collected and send to a recycling center where they are boiled and made into bricks. Coming to the following stage, they are shredded and melted before aluminium bars. In the next stage, the bars of aluminium are rolled into flat sheet. Coming to the last stage, they are molded into cans which are ready to be used again. In conclusion, this process seems to be lucrative and highly efficient, in addition, it prevents pollution of used aluminium cans.
PTE Describe Image Practice 4
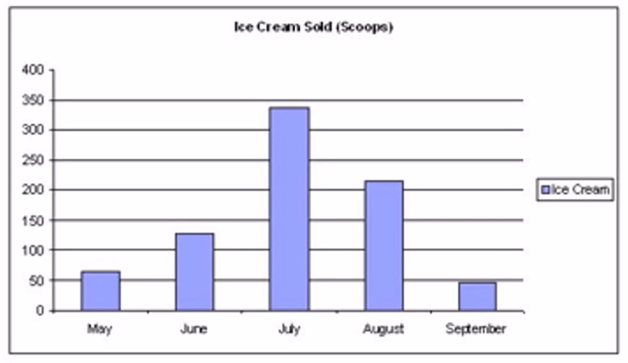
Ice Cream Scoops Sold PTE
The bar graph represents the number of scoops the ice cream sold from the month of May to September. In the month of May, just over 50 scoops of ice cream were sold. We saw a certain increment in sales during June with about 130 scoops of ice cream sold. In July company experienced the most number of ice cream sales of about 340 scoops. August 210 and September 50 were sold. Therefore we noticed the decline in sales probably because of the beginning of winter. In conclusion, July was the most profitable while September was the least profitable month for this company.
PTE Describe Image Practice 5
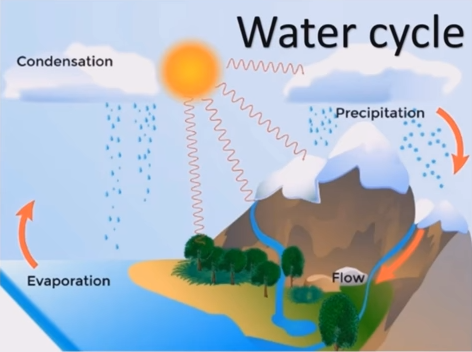
Water Cycle PTE Describe Image
This image represents the natural water cycle. Firstly water gets evaporated due to the heat of the sun of the solar radiation. Secondly, water vapor rises in the sky and condensation occur to form clouds. Thirdly clouds move according to the wind current in the sky. In the next stage, clouds come in the proximity of mountains precipitation occurs in form of snow. Finally, due to solar radiation, the snow melts and the melted water flows down towards the water reservoir to repeat this cycle. In conclusion, this natural cycle is the reason for all life on earth.
PTE Describe Image Practice 6
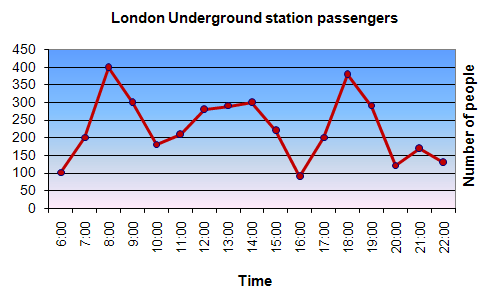
PTE Describe Image Practice
This line graph represents the number of passenger traveling at the London underground station from 6 am to 10 pm. At 6 am in the morning there is on the rush with only about 100 passengers. In the next few hours traveling rises to 400 at 8 am, which is the peak hour. The number of people traveling fluctuates until it detains the lowest number at 4 pm. Before rising dramatically to around 400 people. The number drops back to it’s lowest between 8 pm to 10 pm. In conclusion, the two peaks represent the employee traveling to and from their work.
PTE Describe Image Practice 7
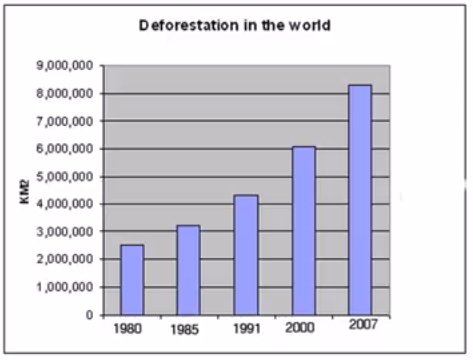
Deforestation Bar Graph PTE Describe Image
The bar chart represents the deforestation per square KM in the world from the year 1980 to 2007. During 1980 about 2 million square km land was locked. In the next 5 year additional 1 million square kilometers was cleared of the trees. In years 1991, 2000 and 2007 approximately 2 million square kilometers of land was deforested. In conclusion, the rate at which the land was deforested was incremental which is not very promising for a better future.
PTE Describe Image Practice 8
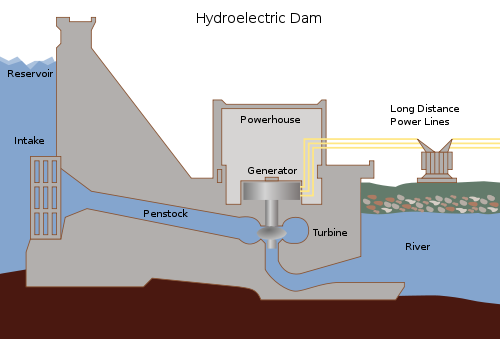
PTE Hydroelectric Dam
This image represents the structure of a hydroelectric dam. There is water reservoir one side of the dam where water is stored. The water is taken from the intake and through penstock, it leads to the turbine and rotates it. The turbine is connected to the generator where electricity is generated. The power powerhouse where the generator is located has the power lines to distribute the electricity through the long distances. The water that comes out of turbine is released in the river. In conclusion, this renewal source of energy seems to be very lucrative and efficient which enlightens our daily life.
PTE Describe Image Practice 9
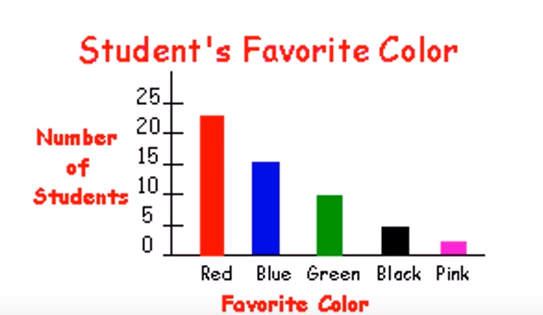
PTE Describe Image Example Favourite Colour
This bar chart represents the students favorite colour. The survey includes responses from 25 students. About 23 students that their favorite colour is red. While 15 stated that they like the blue colour. About 10 states that they fantasy green. And 5 for black color. Least number of students liked pink color. In conclusion, it is clear that red is the most favorite colour and pink is the least selected color by students of this survey.
PTE Describe Image Practice 10

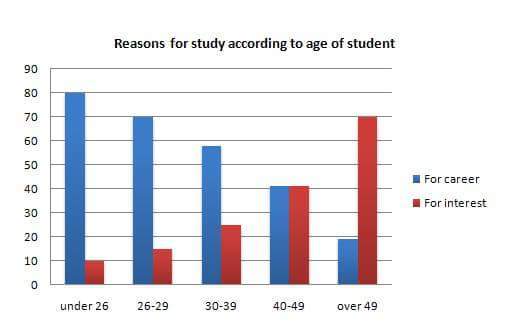
PTE Bar Graph Study
The bar graph represents the reasons for study according to the age of students. About 80 students under age 26 choose to study to develop their career while only 10 are doing it because studying is their interest. There are the equal number of students in the age groups of 40 to 49 who choose studying is a hobby and as a career. On the other hand, students of the age of 49 prefer studying because it is their interest. In conclusion younger students study for making their career and older students study because it makes them happy.